Developments
In Interferometry
Interferometry
is used as a routine quality monitoring test for optical components and
systems at wavelengths ranging from the visible to above 10 microns. The
technique has been available as a commercial tool since the early 1970s
and a number of well respected manufacturers such as Precision-Optical
Engineering, FISBA OPTIK, Zygo and Wyko Optical Metrology*, have over
the years, through healthy competition, ensured that the latest
developments have been incorporated into the instrumentation as the
technology has evolved. In the infrared the main wavebands used are from
3 to 5 microns and from 8 to 12 microns. The visible and infrared
wavebands form a natural division in the field of interferometry.
Interferometers are used in a host of applications. In the visible
region, this includes the evaluation of glass or plastic optical
components such as flats, lenses, and prisms, as well as precision metal
components as diverse as bearings and computer disks and polished
ceramics with 0.5% to 100% reflectivity. They also have extensive
applications in the field of ophthalmology, for contact lenses and
contact lens moulds. Infrared interferometry is used for the
evaluation of optical systems and materials used in this region of the
spectrum and is used extensively in military applications. In addition,
operating at wavelengths of 8-12 microns allows interference fringes to
be produced from certain aspheric surfaces, and the shape of ground
surfaces can be measured, which would be impossible using visible
interferometers. This review aims to highlight some of the key
developments in the field of interferometry and does not claim to be
exhaustive.
Interferometry principles and basic designs
The
technique involves measuring the distortions in a wavefront from a
coherent beam of light interacting with the test piece compared to a
reference beam. The interference patterns which result from differences
between the test beam and the reference beam appear as a set of black
and white fringes which yield information which can be related to
surface form errors or optical waveform distortion errors. In this way,
geometrical aberrations in optical systems, badly manufactured optical
components and inhomogeneities in materials can all be readily
identified. The two most commonly used designs for commercial
interferometers are the Fizeau and Twyman-Green geometries shown in
Figure 1. Both types are used in commercial visible interferometers. The
Twyman-Green configuration is generally used in infrared interferometers
such as the INTERFIRE 10.6 from Precision-Optical Engineering).
Developments
in optics
In the early
interferometers, the light source was a thermal source and the
interference pattern was projected onto a screen and viewed by eye.
Thermal sources did not have sufficiently narrow spectral lines to
provide a high level of coherence, so in the Fizeau arrangement, the
beam splitting surface had to be very close to the surface under test,
and in the Twyman-Green system the reference mirror had to be adjusted
on a rail to equalise path lengths. For infrared applications, thermal
sources did not have sufficient intensity to stimulate the detector. All
this changed with the arrival of usable lasers, which gave a long
coherence length and an abundance of power to stimulate the sensor,
coupled with the development of suitable sensors, particularly the
pyroelectric vidicon camera and more recently infrared focal plane
arrays. For visible applications, the HeNe laser is used extensively,
while in the infrared, HeNe, CO or CO2 lasers are used. The amount of
power available varies greatly and it is becoming difficult to obtain a
low power CO2 laser so the most sensitive sensors tend to be ignored and
pyroelectric sensors are used. Using a 3.39 micron HeNe laser, the power
tends to be low so a cooled staring array sensor is preferred. Laser
light sources greatly extended the complexity of optical systems that
could be tested. Another major development has been the use of optical
fibres. Delivery of the laser light to the beam splitter by optical
fibre means that the laser can be located away from the interferometry
optics, which has made a major contribution to the ability of
manufacturers to miniaturise systems. Another significant development
has been the use of CCD cameras, which allowed fringes to be viewed
directly on a monitor, followed by frame grabber technology, which
allowed the images of fringes to be acquired into a computer for
measurement and analysis. The compact size of high resolution CCD
cameras means that they can be fully integrated into the interferometer,
and systems are available which offer an excellent 1000 X 1000 pixel
resolution. The interferometer is essentially a comparator, and the
ultimate accuracy of measurements is determined by the quality of the
reference flats and spheres used as the external calibration system in
the particular measurement configuration. Reference optics should be
traceable - usually to an national or international standard. External
standards are typically supplied with an accuracy of 30-60 nm (lambda/20
to lambda/10) but lambda/30 and lambda/40 calibration flats are also
available. Repeatability of measured surface shape is typically in the
range of 5-10 nm (about lambda/100).
Fringe and
phase shift analysis - the software revolution
Once the
interference fringes have been obtained they need to be measured and
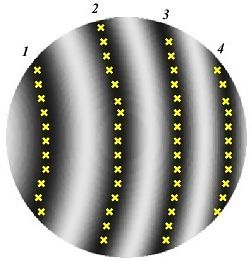
analysed. The simplest and original method, illustrated in Figure 2
involved taking a photograph of the fringes and measuring them with a
ruler! The arrival of the PC and frame grabbers brought a revolution in
fringe analysis. In its simplest form (Figure 3), typically 200 - 300
digitised points are taken along the fringes using maxima and minima
detection routines. Increasing computing power allowed an ever
increasing range of complex fringe analysis functions to be carried out.
These include analysis of multiple fringes and full quantitative
wavefront analysis including Modulation Transfer Function (MTF), Point
Spread Function (PSF) and slope error. Wavefront shape can be fitted to
Zernike polynomials enabling the calculation of Seidel Aberrations. The
software can also flag pass/fail criteria based on irregularity, power,
peak to valley wavefront value and rms wavefront aberration. Higher
accuracy of measurements can be achieved using a technique known as
phase shifting. This involves using a piezo transducer to move the
reference optic by around lambda/2 and utilising dedicated phase shift
analysis software to provide full analysis of circular, multiple, low
contrast and nulled fringes. Results can be displayed directly in terms
of ISO and DIN standards. An example screen display from phase analysis
is shown in Figure 4. Phase measuring interferometry is the more
accurate technique since it offers higher density and uniform sampling
of the interference pattern, and better phase resolution. However,
despite the sophistication of the software currently available, it
should be emphasised that automatic fringe or phase shift analysis is
not a deskilled function and an understanding of what is happening in
the optical system can still be very important in the interpretation of
results. This is of particular importance in infrared applications.
Signal-to-noise in infrared interferometry
Infrared
interferometry relies on sensing using an infrared camera. The cameras
exhibit random noise on the video signal which is most obvious in the 3
to 5 micron waveband, since affordable lasers tend to be of low power
(typically 5-10 mWatts). High signal gain is therefore necessary to
provide sufficient contrast for recording fringe patterns or analysing
fringe patterns using either static or phase shifting software. The
profile of the laser beam is also important when laser power is marginal
since this may cause contrast variations across the interferogram. This
is particularly noticeable when using HeNe lasers at 3.39 microns where
perhaps only 5 to 10 mWatts of power is available. This can have the
effect of making fringes appear both fainter and thinner towards the
edge of the pupil. When analysing with static fringe analysis packages
care needs to be taken to check that the digitised fringes accurately
represent the real shape of the fringe pattern. With the reducing cost
of cooled staring arrays in the 3-5 micron band, with much lower Noise
Equivalent Temperature Difference than pyroelectric vidicons, high
signal gain can be used without the penalty of increased noise.
The problems
raised by laser power profiles are greater when using phase shifting
systems, since at least with static fringe analysis software some manual
correction of digitised points is allowed. Phase shifting systems have a
threshold contrast below which phase will not be measured. Reducing the
threshold too far means that the system can pick up on random noise in
the picture and allocate phase values which are significantly
larger than any other area of the pupil, producing a gross distortion of
the results. There is therefore a fine balance between ensuring that
phase information is available over the whole pupil without random noise
causing a problem. These problems can be alleviated through the use of
either a high quality higher power laser or a highly sensitive, low
noise affordable detector. At 10.6 microns, however, these problems
don't occur. In fact, excess energy from the laser source needs to be
removed, using for example CaF2 filters or wire grid polarisers.
Polarisers are essential in tunable laser system since the availably
absorbing filters do not act uniformly across the waveband. There is
more than sufficient power available to enable the pyroelectric vidicon
camera to be set to low gain, thereby reducing noise to an insignificant
level.
Diffraction
effects in infrared interferometry
Some of the
experimental conditions for infrared interferometry are rather different
to those in the visible region, so special care must be taken in the
setting up of the measurement, and the results analysed in as rigorous a
manner as possible. Infrared optical systems are being produced with
smaller optical apertures than previously for reasons of weight, cost
and configurability. This trend has been aided by improvements in the
detector technology. The result is that the IR lens for a camera system
may have an aperture comparable in size to a visible camera system.
However the wavelength in the IR system may be as much as twenty times
greater than in the visible band. This makes the effects of diffraction
much more dominant in IR interferometry, requiring that optical pupils
are well focused onto the interferometers camera sensor surface. Because
of the double pass nature of most commercially available
interferometers, the aperture is seen twice by the interferometer - if
the two images of the optical aperture are not conjugate with one
another then some diffraction is inevitable. The effects of this must be
minimised to enable accurate analysis. It is important that any analysis
of the interferograms takes into account the limitations of the method.
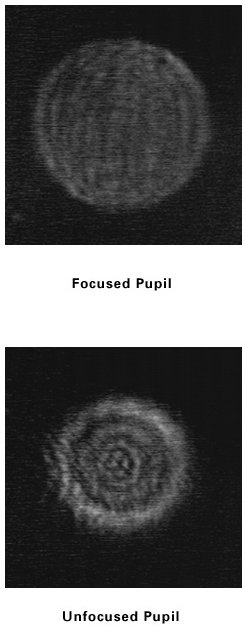
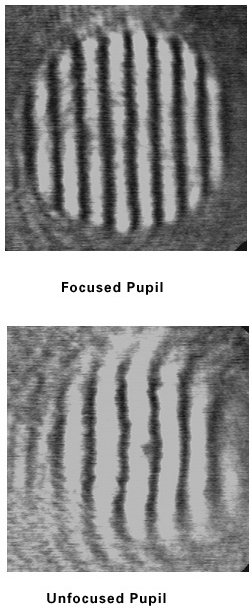
Figure 5 shows the effect of diffraction on the pupil imagery in the
interferometer. In the unfocused case, diffraction rings can clearly be
seen inside the pupil. This has the effect of breaking up the
interference pattern such that the fringes are discontinuous or vary in
width due to contrast changes. Any automatic fringe analysis program
must be used with caution when analysing such fringes. In these cases
the peak to valley wavefront aberration reported will be worse than the
actual aberration for the lens under test. While Figure 5 shows the
effect of diffraction within the optical pupil, the other common case is
when the diffracted radiation appears outside the pupil. This has the
effect of blurring the pupil edge so its size is uncertain and, because
the diffracted radiation has a different curvature to the main beam, any
interference fringes will curve within this zone. The effect is very
similar to that seen with Spherical Aberration especially that of higher
order and if not corrected can lead to a large departure in measured vs.
actual performance. This situation is shown schematically in Figure 6.
Here, if information is known about the size of the pupil within the
interferogram, it is possible to mask out much of the effects of
diffraction simply by ignoring those parts outside the pupil.
There will
be cases where it is impossible to achieve good pupil imagery without
going to great expense. In such circumstances, double pass
interferometry can still provide a confidence test on system
performance, but ultimate proof may require a single pass test, either
by interferometry or by non coherent broad band MTF testing or similar.
Miniaturisation of visible systems
As we have
seen, the Twyman-Green configuration can have the laser beam delivered
via an optical fibre. Since the laser no longer needs to be an integral
part of the instrument, the basic interferometer can be miniaturised.
Indeed by incorporating a phase shifter and a CCD camera, the instrument
becomes an interferometer probe. Instruments such as the Digital Compact
Interferometer 2 (DCI 2) from FISBA OPTIK physically measure 110
mm x 45 mm x 70 mm excluding the objective, yet features a high
resolution 1000 x 1000 pixel CCD camera. A large choice of
interchangeable modular objectives brings versatility for measurement of
plane and spherical surfaces in a variety of instrumental set ups by
mounting the interferometer on an adjustable, vibration isolated stand
incorporating a test sample stage featuring 4 degrees of freedom. This
arrangement can easily be used in the factory, workshop and laboratory.
FISBA's µPhase
instrument is even smaller, measuring just 61 mm x 37 mm x 28 mm without
the objective and is suitable for normal resolution requirements in
production areas and optical workshops for repetitive measurements and
serial-production testing. However, because of its extremely small size,
it can be fitted directly onto a wide range of machines or incorporated
into OEM instruments to make in situ measurements. Such equipment
includes lathes, polishing machines, optical manufacturing machines and
contact lens manufacturing systems. These ultra-small interferometers
also have applications in the measurement of cylindrical components.
Detailed discussions of any of these specific applications is beyond the
scope of this review.
Miniaturisation of infrared Systems
The size of
infrared interferometers has also reduced over the years. Twenty years
ago a typical open plano IR interferometer with a 150~200 mm aperture
would have covered a 12ft x 4ft table. Slow optics tended to be used for
the sake of optical safety. The advent of new manufacturing processes,
particularly diamond machining, has meant that accurate fast optics can
be used which greatly reduce the size of the interferometer. The sensor
packages have tended to remain about the same size, but smaller lasers
have been available in the 8 to 14 micron band leading to overall
packages with lengths of the order of 500 mm for a 35 mm output pupil.
Increasing the aperture requires external beam expanders which can be
geared to the actual application Ü a 30 to 150 mm beam expander would
be similar in size to the interferometer.
* Wyko Optical Metrology was acquired by Veeco Instruments Inc. in 1997
.
Figure
1. Fizeau and Twyman-Green interferometer configurations

Figure
2. Simple fringe analysis
Figure
3. Digitisation of fringe centres
Figure
4. Screen display from 'µShape' phase shift analysis software from
FISBA OPTIK
Figure
5. Diffraction effects in the infrared region
Figure
6.Pupil imagery effects on fringes in the infrared region
Authors:
David Page, Technical Manager, Precision-Optical Engineering, 42 Wilbury
Way, Hitchin, Herts, UK, SG4 0TP. Tel: +44 (0)1462 440328. Fax : +44
(0)1462 440329.
E-mail: sales@p-oe.co.uk Internet : http://www.p-oe.co.uk
and: Ian
Routledge, Armstrong Optical Ltd, Poplar Farm, Caldecott, Chelveston,
Northants, NN9 6AR
Tel: 01933 622222
Fax: 01933 622226. E-mail: armoptical@aol.com Internet http://www.armstrongoptical.co.uk
|